$ORCL +3.91% on 1.3× volume
Setup: +2.6% to +5.9% day, on ≥1.3x avg volume, below the 50-day. Here is what happened after days like this, and the exact rule so you can test it yourself.
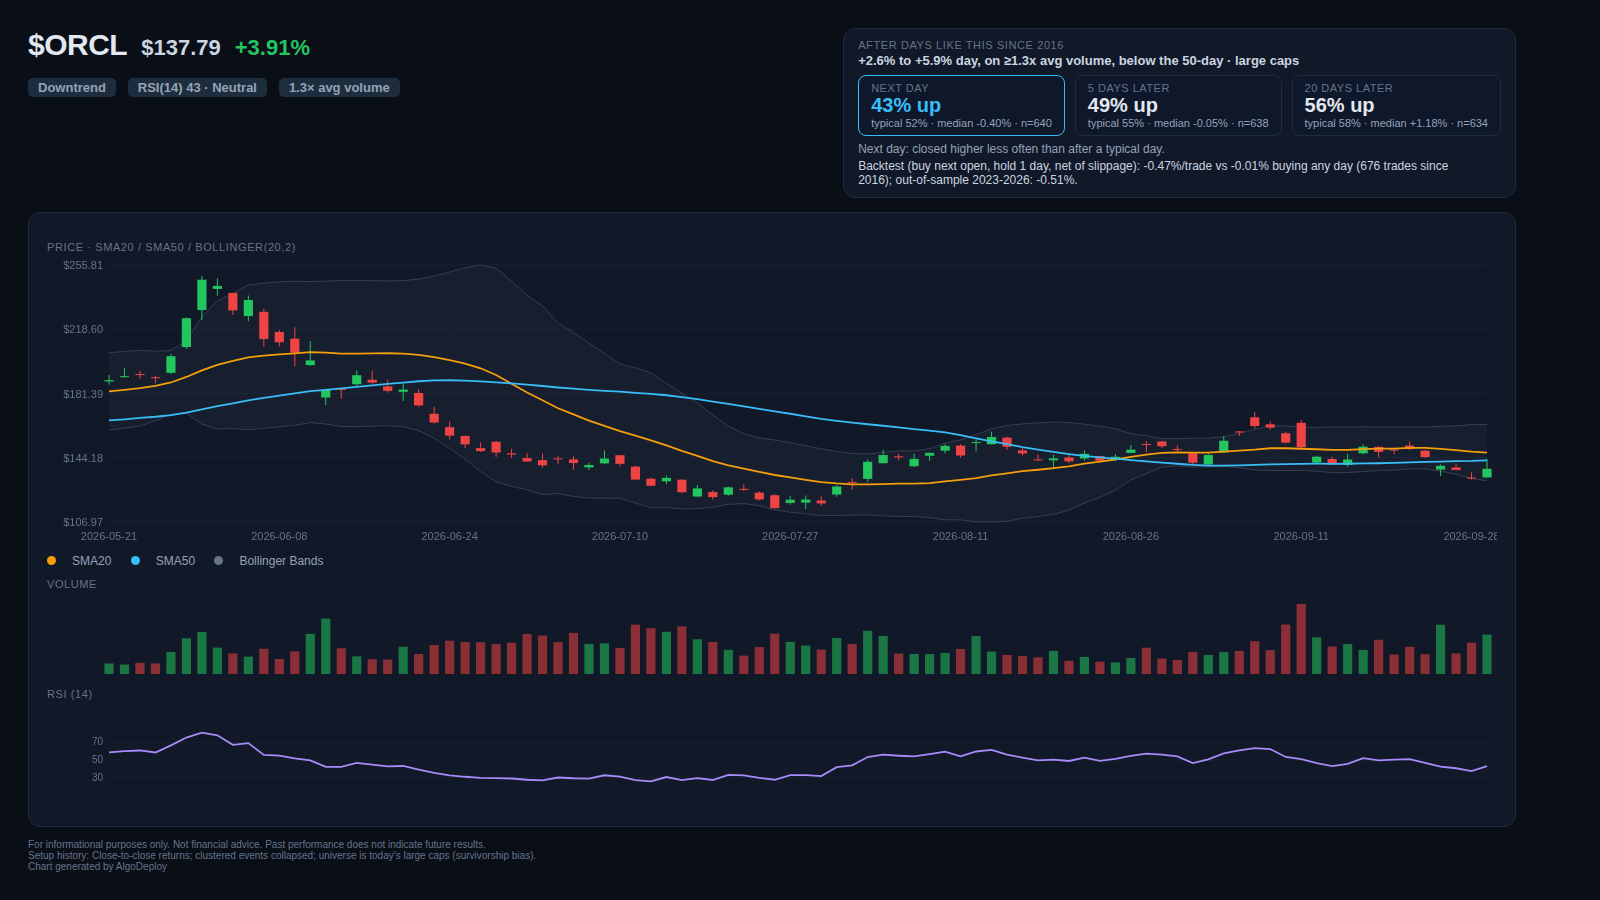
After days like this
Matching days: +2.6% to +5.9% day, on ≥1.3x avg volume, below the 50-day · large caps. How often the stock closed higher afterwards, vs. a typical day (since 2016).
Next day: closed higher less often than after a typical day.
Every setup that fired today
What made the day unusual:
- 1.2-sigma move vs its 20-day volatility; #27 biggest up day for ORCL in the past year
- Gap +0.1%, open to close +3.8%
- Closed 47% of the way up the day's range
- SPY -0.2%; +4.5% of the move was ORCL-specific (beta-adjusted)
- RSI(14) 43
- -55.6% from its 52-week high, +19.8% from its 52-week low
Each setup below matched today's bar. Each was tested on 58 large caps over 10 years: buy the next open, hold 1, 5 or 20 days, net of slippage, vs. doing the same on any day. Shown: each setup's strongest holding period. Because many setups are tested every day, an edge only counts with |t| ≥ 3, 30+ events, and the same direction before and after the out-of-sample split.
| Setup | Hold | Events | Mean / trade | Any day | t | Out-of-sample | Verdict |
|---|---|---|---|---|---|---|---|
| +2.6% to +5.9% day, on ≥1.3x avg volume, below the 50-day | 1d | 618 | -0.48% | -0.01% | -3.7 | -0.63% | Edge held up |
| A stock-specific rally (>= 3% beyond what SPY explains, SPY within ±0.5%) | 5d | 1623 | +0.64% | +0.33% | +1.7 | +0.56% | No reliable edge |
| No gap (under 0.5%): the whole move built during the session | 1d | 2816 | -0.07% | -0.01% | -1.0 | -0.02% | No reliable edge |
| Up day below the 200-day average | 20d | 1451 | +2.38% | +1.61% | +2.3 | +2.86% | No reliable edge |
The rule, backtested
Buy at the next open after a matching day, hold 1 day, sell at the open. Run on 58 large caps with slippage, compared with buying any day the same way. The out-of-sample period is the most recent 30% of the data.
Backtest (buy next open, hold 1 day, net of slippage): -0.47%/trade vs -0.01% buying any day (676 trades since 2016); out-of-sample 2023-2026: -0.51%.
| Period | Dates | Trades | Win rate | Mean / trade | Median | Any day: win | Any day: mean |
|---|---|---|---|---|---|---|---|
| All | 2016-09-30 to 2026-09-29 | 676 | 44% | -0.47% | -0.28% | 50% | -0.01% |
| In-sample | 2016-09-30 to 2023-09-29 | 474 | 45% | -0.45% | -0.21% | 50% | -0.02% |
| Out-of-sample | 2023-09-30 to 2026-09-29 | 202 | 40% | -0.51% | -0.39% | 49% | +0.01% |
Run this setup yourself
This is the complete AlgoDeploy config behind the backtest above. Change symbol
to test the same setup on any ticker, or adjust the thresholds and holding period.
# AlgoDeploy setup rule for ORCL, from its 2026-09-29 move.
# Run:  algodeploy backtest setup_rule.yaml
# Change `symbol` to test the same setup on any ticker.
name: "Setup: +2.6% to +5.9% day, on ≥1.3x avg volume, below the 50-day, hold 1d"
symbol: "ORCL"
start: "2016-09-30"
end: "2026-09-30"
equity: 100000
data:
  provider: "yfinance"
entry:
  conditions:
    - "pct_change(1) >= 0.026"
    - "pct_change(1) <= 0.059"
    - "volume_ratio(20) >= 1.3"
    - "close < sma(50)"
  position_size: "95%"
exit:
  max_hold_days: 1
fill_on: "next_open"
slippage_bps: 5
commission_per_share: 0.005
Backtest this setup on your own machine
Start a 7-day free trial of AlgoDeploy, then run the rule above. Same engine for backtesting and live trading, and your strategies and keys never leave your computer.
Start your 7-day free trial- Start your free trial and install AlgoDeploy.
- Save the rule above as
setup_rule.yaml(or download it). - Run
algodeploy backtest setup_rule.yamlto get the full HTML report.
Method: a "matching day" is one with the setup above. History uses close-to-close returns with clustered events collapsed; the rule backtest uses next-open fills with 5 bps slippage per side. The universe is today's large caps, which carries survivorship bias (names that became large caps because they rose).